Development of a predictive model for the side effects of liraglutide
Article information

Abstract
Background
Liraglutide, a drug used for the management of obesity, has many known side effects. In this study, we developed a predictive model for the occurrence of liraglutide-related side effects using data from electronic medical records (EMRs).
Methods
This study included 237 patients from Seoul St. Mary's Hospital and Eunpyeong St. Mary's Hospital who were prescribed liraglutide. An endocrinologist obtained medical data through an EMR chart review. Model performance was evaluated using the mean of the area under the receiver operating characteristic curve (AUROC) with a 95% confidence interval (CI).
Results
A predictive model was developed for patients who were prescribed liraglutide. However, 37.1% to 75.5% of many variables were missing, and the AUROC of the developed predictive model was 0.630 (95% CI, 0.551–0.708). Patients who had previously taken antiobesity medication had significantly fewer side effects than those without previous antiobesity medication use (20.7% vs. 41.4%, P<0.003). The risk of side effect occurrence was significantly higher in patients with diabetes than in patients without diabetes by 2.389 times (odds ratio, 2.389; 95% CI, 1.115–5.174).
Conclusions
This study did not successfully develop a predictive model for liraglutide-related side effects, primarily due to issues related to missing data. When prescribing antiobesity drugs, detailed records and basic blood tests are expected to be essential. Further large-scale studies on liraglutide-related side effects are needed after obtaining high-quality data.
INTRODUCTION
Obesity is a crucial problem worldwide [1]. In Korea, the prevalence of obesity increased from 29.7% to 32.4% from 2009 to 2015, accompanied by a concomitant increase in the prevalence of abdominal obesity from 18.4% to 20.8% [2]. The major complications of obesity include chronic diseases, such as diabetes, hypertension, fatty liver disease, cardiovascular disease, and depression [3,4]. Obesity is a chronic disease that requires strict management because the obesity-related social and economic burdens are increasing with the growth of medical expenses associated with obesity [5].
Liraglutide, a glucose-like peptide-1 receptor agonist (GLP-1 RA), has been approved for obesity treatment [6]. Liraglutide was originally approved as a treatment for type 2 diabetes and later emerged as a treatment option for obesity. Although both contain liraglutide, Victoza (Novo Nordisk, Bagsvaerd, Denmark), often used as a treatment for diabetes, is available through insurance benefits, whereas Saxenda (Novo Nordisk) is not covered by insurance. However, the price of Saxenda is different, and data on its usage in Korea are unavailable since it is imported. The usage of Saxenda is not well understood even in reviews of claims data from the Health Insurance Review and Assessment Service, the results of which are sent to the National Health Insurance Service [7]. Analyses of electronic medical records (EMRs) of university hospitals are advantageous for determining the side effects of a drug, since EMRs contain properly recorded data [8,9]. In this study, the researchers aimed to develop a predictive model for the occurrence of side effects of Saxenda injections using EMR data from a university hospital.
METHODS
Ethical statements
This study was approved by the Institutional Review Board of the Catholic University of Korea (No. KC21RNSI0831). The requirement for informed consent was waived due to the retrospective nature of the study. All data were stored on an encrypted computer of the principal investigator in an encrypted file that was only accessible to the principal investigator. The predictive model was converted to an anonymized file.
Study population
Patients who were prescribed liraglutide (Saxenda) and whose baseline weights were recorded at Seoul St. Mary’s Hospital and Eunpyeong St. Mary’s Hospital between 2014 and 2019 were included in this study. Patients’ demographic information, baseline body information, medical history, involvement in previous drug trials for obesity, and baseline laboratory test results at the time of the first liraglutide prescription were used as candidate predictors in the model. Demographic information included age, sex, height, and weight. Baseline body information included body mass index (BMI), skeletal muscle mass, body fat mass, percent body fat, waist-hip ratio, systolic blood pressure, and diastolic blood pressure. Medical history included previous history of hypertension, diabetes mellitus, fatty liver disease, thyroid disease, gastrointestinal disease, psychiatric disease, or skin allergy. Information on involvement in previous drug trials for obesity included previous use of the following: lorcaserin, a combination of bupropion and naltrexone, orlistat, or another GLP-1 RA, such as exenatide, dulaglutide, or lixisenatide. Baseline laboratory testing included serum glucose, glycated hemoglobin, blood urea nitrogen, creatinine, glomerular filtration rate, total bilirubin, aspartate transaminase, alanine transaminase, alkaline phosphatase, γ-glutamyl transpeptidase, creatine phosphokinase, total cholesterol, triglyceride, high-density lipoprotein cholesterol, and low-density lipoprotein cholesterol levels. All data were extracted through a direct EMR chart review by an endocrinologist with over 10 years of experience.
Predictive model output
The model predicted the occurrence of side effects (including digestive, nervous system, and pruritic side effects) within 7 months of Saxenda administration using patient information at the time of prescription.
Missing data
Variables with a large missing rate (>45%) were excluded. As a multiple imputation method for the remaining data, the multivariate imputation by chained equations algorithm with random forests was used [10,11].
Feature selection
A stepwise backward feature elimination technique with a stratified 10-fold cross-validation technique was used for feature selection [12,13]. The least important features measured from support vector machine algorithms were excluded step by step until one feature remained. Finally, the subset of features that optimized the average area under the receiver operating characteristic curve (AUROC) from 10 folds was used to develop the predictive model.
Development and evaluation of the predictive model
The eXtreme Gradient Boosting (XGBoost) technique was used to develop a Saxenda side effect prediction model [14]. Stratified 10-fold cross-validation, which is a helpful procedure to estimate the performance of a small dataset [15], was used to train and evaluate the predictive model. The dataset was randomly divided into 10 subparts of equal size. Nine subparts were used for training the model, and the remaining subpart was used for evaluation. This process was repeated 10 times. The Shapley value was used to measure feature contributions to the model prediction [16,17].
Statistical analysis
Continuous variables were described as means with standard deviations, and categorical variables were described as frequencies with percentages. The t-test was used for continuous variables, and the chi-square test was used for categorical variables for comparisons between groups with and without side effects. The model performance was evaluated using the mean of the AUROC with a 95% confidence interval (CI), along with the means of sensitivity, specificity, negative predictive value (NPV), positive predictive value (PPV), and accuracy in 10 folds from the stratified 10-fold cross-validation technique. We conducted multivariate logistic regression to investigate the associations between predictors and side effect outcomes. A P-value <0.05 was considered to indicate statistical significance for all tests. For statistical analysis and modeling, R ver. 4.0.3 (The R Foundation, Vienna, Austria; https://www.r-project.org/) and Python ver. 3.8.5 (Python Software Foundation, Wilmington, DE, USA; https://www.python.org/) were used.
RESULTS
In total, 237 patients were included in the study, excluding those whose body weights were not recorded in EMRs. Side effects occurred in 75.5% (179 of 237 patients), and no side effects occurred in 24.5% (58 of 237 patients).
The missing rate for BMI was 1.7% (4 of 237 patients), but for other baseline information, such as skeletal muscle mass, body fat mass, percent body fat, and waist-hip ratio, the missing rate was 75.5% (179 of 237 patients). The missing rate for blood tests varied from 37.1% to 60.8% (Table S1). For further analysis, 20 variables were selected, excluding those with a missing rate of ≥45%.
Table 1 shows the differences across 20 variables according to the presence or absence of side effects after Saxenda injections. The mean age was 43±13 years, and 64.5% of patients (176 of 273) were women. Their average BMI was 30.7±5.1 kg/m2, and there was no significant difference in BMI between patients with and without a history of side effects. Significantly fewer side effects were observed in patients with a history of previous antiobesity medication use than in those without prior history of antiobesity medication use (20.7% vs. 41.4%, P<0.003). Other laboratory tests showed no significant associations with whether patients experienced side effects.

Baseline characteristics of the study population
After excluding variables with over 45% of missing data, backward feature elimination was performed on the remaining 20 variables. The AUROC was computed according to the number of selected variables; as such, all variables were selected (Fig. S1). The average AUROC obtained using the side effects prediction model was 0.630 (95% CI, 0.551–0.708), the average sensitivity was 0.423, the average specificity was 0.760, the average PPV was 0.368, the average NPV was 0.805, and the average accuracy was 0.679 (Fig. 1).

Area under the receiver operating characteristic curve (AUROC) of the side effect prediction model. CI, confidence interval.
Fig. 2 shows the six variables that had the greatest influence in the side effects prediction model, using 10 model predictions. A previous history of antiobesity medication intake had the strongest influence in the predictive model. Imputation was conducted for laboratory tests due to the high missing data rate, and creatine levels were found to have a strong influence on the occurrence of side effects.
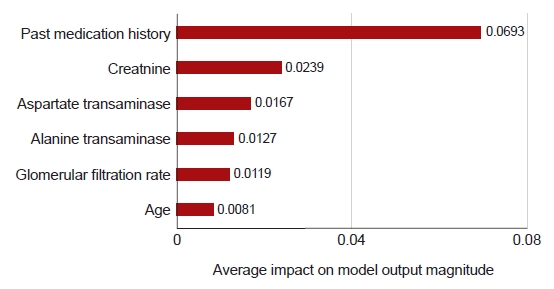
Contribution of features to the model predictions.
Logistic regression analysis showed that patients with diabetes had a significantly higher risk of developing side effects than patients without diabetes (odds ratio [OR], 2.389; 95% CI, 1.115–5.174) (Table 2). The incidence of side effects was significantly higher in women (OR, 2.143; 95% CI, 0.920–5.432) and in patients with gastrointestinal disease (OR, 10.822; 95% CI, 1.003–254.964). Hypothyroidism was excluded from the OR analysis, since no prior history was elicited in patients without side effects.
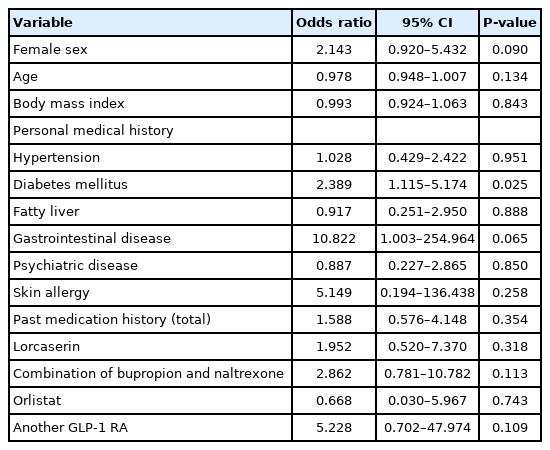
Logistic regression analysis
DISCUSSION
The monitoring of drug side effects plays an important role in evaluating the safety of drugs on the market, which is a public health concern [18]. Therefore, increasingly many clinical trials using EMR data are being performed [19,20]. An advantage of EMR studies is that they can easily extract a large amount of data from a long period of time at a relatively low cost; therefore, EMR-based clinical research has been conducted with various study designs [8,9]. Since most side effects of liraglutide are subjective, a cohort study with a large population is advantageous for measuring the incidence of these adverse effects [21]. EMR data, in which subjective symptoms of patients are well documented, are particularly suitable for this purpose. However, a consequence of the reliance upon chart reviews in this study is that the side effects experienced by the patients may not have all been due to liraglutide. Furthermore, it is difficult to confirm or completely rule out minor side effects from liraglutide use.
In this study, the AUROC of the side effect prediction model after Saxenda prescriptions was low (0.630). The excessive amount of missing data may have been one of the main reasons for the model’s poor performance. In particular, 75.5% of patients had missing data on skeletal muscle, body fat mass, body fat percentage, and abdominal fat percentage before obesity medication use, which would be helpful for follow-up. The data recorded in the EMRs were not as well documented as expected, and in many cases, baseline tests were not performed prior to prescribing liraglutide. Since EMR data are not generated for research purposes, it was expected that the missing rate would be high [22], and the inability to include other variables is a major cause of the low prediction rate.
In our study, XGBoost was used to develop a predictive model, considering its good support for explainability even when missing values are expected; furthermore, it has shown favorable results with longitudinal healthcare data [23]. The researchers conducted 10 model predictions to increase the AUROC score; however, the final results did not meet the expectations. In addition, there were no significant differences in patient characteristics in relation to the occurrence of side effects after Saxenda administration. Since the researchers performed imputation due to the high missing data rate, it is most likely that these values influenced the Shapley value analysis, contributing to low reliability.
Nevertheless, the most influential factor in the predictive model was the prior use of antiobesity medications. Patients with no prior antiobesity medication use were more likely to experience side effects from Saxenda. Additionally, patients with a prior history of antiobesity medication use who experienced side effects may not have been included in the study because they did continue their use of antiobesity medications. Patients who have taken antiobesity medications in the past and have experienced side effects may not have reported relatively minor side effects. Conversely, patients taking Saxenda for the first time may have reported any and all minor side effects. These suggest that patient compliance may have affected the results of the study, which is also an important characteristic of real-world data [8]. Therefore, careful interpretation of these results is necessary.
It is also worth noting that people with diabetes were 2.4 times more likely to experience side effects. Liraglutide was developed for the treatment of diabetes as a GLP-1 RA [24]. Therefore, it is most suitable for patients with obesity and diabetes; however, more side effects occurred in patients with diabetes. A possible explanation for this might be that patients without diabetes who are trying to lose weight may be strongly motivated to endure minor side effects. Since Saxenda is administered via injection, patients with diabetes taking Saxenda tend to have poor compliance [25], which may also be relevant for the high observed incidence of side effects in this group.
The researchers attempted to create a predictive model of Saxenda side effects; however, the accuracy of the model was low, and no successful model was ultimately developed. In the future, the successful development of such models will require the analysis of a large amount of EMR data with a low missing rate [22]. When prescribing Saxenda, measurements of various laboratory tests and baseline body information are needed. Many areas need to be seriously considered for the development of predictive models in retrospective cohort studies. It is important to gather diverse and well-organized data with a minimal amount of missing real-world data. Ultimately, this will also help in patient management. Future attempts to develop a successful predictive model will require high-quality data.
SUPPLEMENTARY MATERIAL
Missing rate of variables used in the development of the algorithm.
Area under the receiver operating characteristic curve (AUROC) based on selected variables.
Supplementary materials are available at https://doi.org/10.36011/cpp.2022.4.e12
Notes
Ethical statements
This study was approved by the Institutional Review Board of the Catholic University of Korea (No. KC21RNSI0831). The requirement for informed consent was waived due to the retrospective nature of the study.
Conflicts of interest
The authors have no conflicts of interest to declare.
Funding
This work was supported by a National Research Foundation of Korea (NRF) grant funded by the Korean government (Ministry of Science and ICT) (No. NRF-2021R1G1A1091471).
Author contributions
Conceptualization: JM, JS, HSK; Data curation: HSK; Formal Analysis: HSK; Funding acquisition: HSK; Investigation: HSK; Methodology: HSK; Project administration: HSK; Resources: HSK; Software: HSK; Supervision: HSK; Validation: HSK; Visualization; JM, JS, HSK; Writing–original draft: JM, JS, HSK; Writing–review&editing: JM, JS, HSK.
All authors read and approved the final manuscript.